Phase one
Every asset, named and located.
Within weeks every asset on every property is on the map with its photograph, nameplate, and condition. This is what makes the rest work: a tenant reports a real thing, not “a light in the back”, and the provider knows what to bring.
What you receive
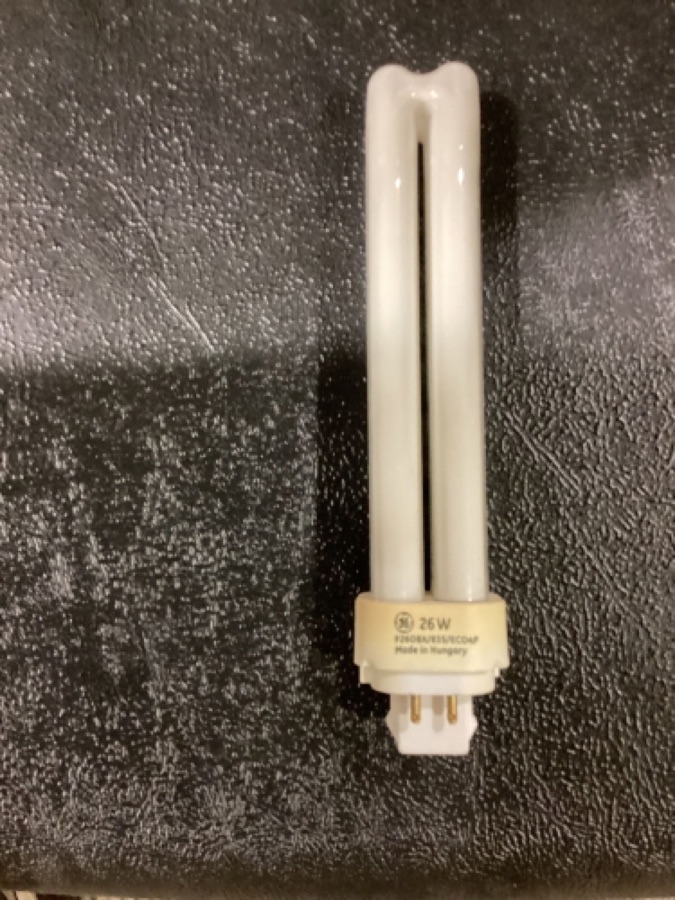
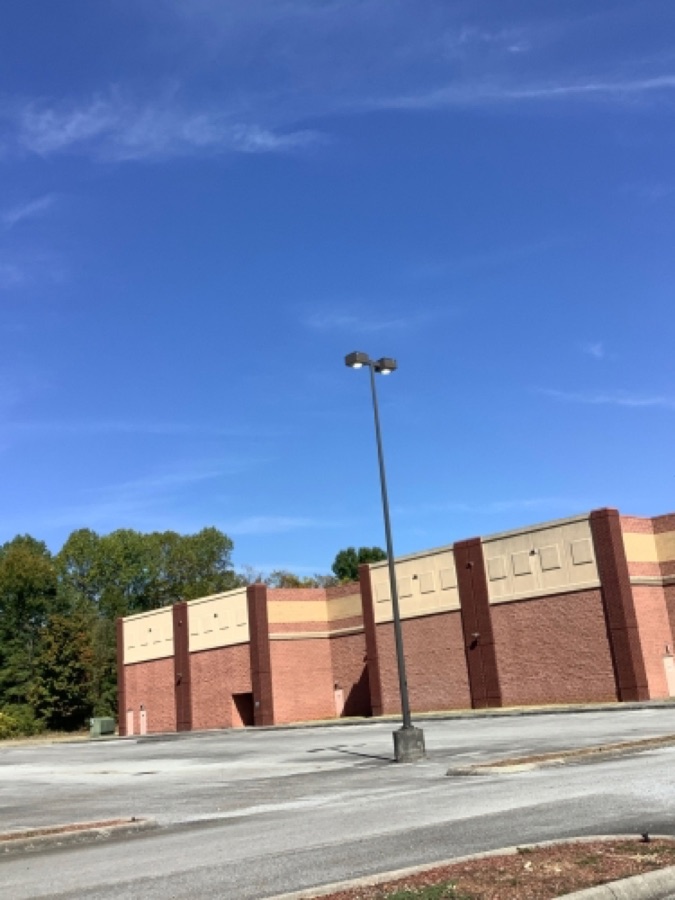
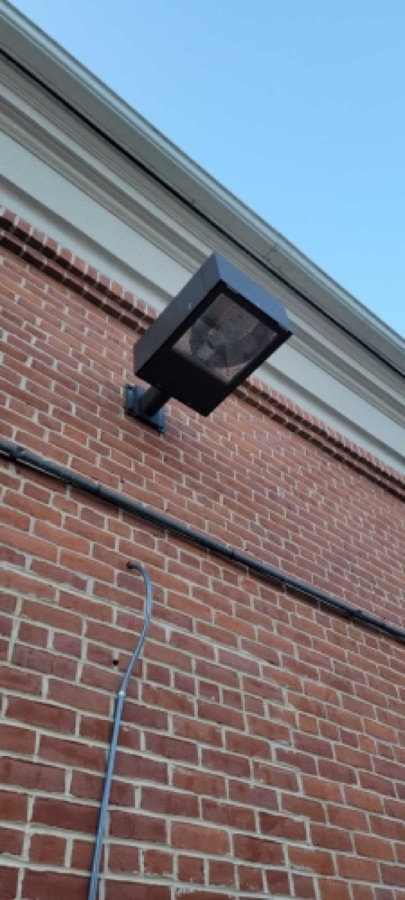
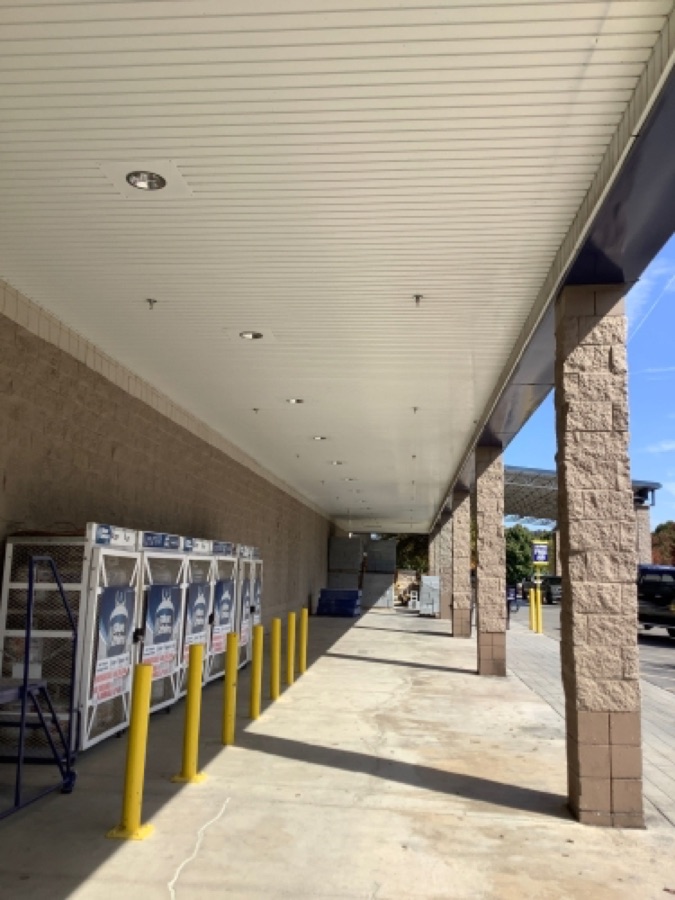
Photographs the provider sees first.
Every asset carries its own photograph, so a report can be verified and a quote checked without sending anyone out to look.
Assets placed
187
With coordinates
187
Asset classes
1
This owner can see all 187 lighting assets today. Rooftop units are not on record yet, and the row says so instead of guessing.
One survey
Complete, or marked incomplete.
You never get a recommendation built on an estimate. Where a class of asset has not been captured, the record says so, so you never dispatch against a guess.
What comes back
It outlasts the people who knew the building.
When a manager leaves, the knowledge of the building usually leaves with them. Yours stays put, so the next manager runs the property the same way on their first day.
What you already have
Nothing gets retyped.
Imported
Existing audits
Prior scope and counts come in as they are, so a survey you already paid for is not repeated.
Imported
Plans and schedules
Site plans, equipment schedules and photometric studies are read for what they contain rather than filed as attachments.
Reconciled
The disagreements
Where the drawing and the building differ, the building wins and the gap is shown. That gap is usually the finding.
What is behind the numbers
Not a calculator. A run history.
Priced options
429,676
Across 3,442 completed design runs.
Labour samples
13,813
Cost learned from finished jobs, not a price book.
Photometric files
7,154
The light on the ground is modelled, not asserted.
Incentive programmes
357
Applied to your assets, not remembered.
The question you will ask
“We already have data. Do we start from nothing?”
No. Existing audits, equipment schedules and site plans are imported rather than retyped, and anything already on file becomes the starting point. Where a document and the field disagree, the field wins and the difference is visible — which is usually the first useful thing you learn.
Next step
Walk one property with us.
Pick a building. We map every asset on it, model what each outage actually costs you in light, safety, and money, and hand you the loop: surface, understand, decide, deploy, prove.
What you get, from the first week.